
Overview of the Brief

This brief aims to provide information that will be useful for coming to your own answers on the three big questions of what to include, how much to spend, and how to pay for it. In the first section, we first review the strongest case for an overall infrastructure package that is big both in the sense that it is broad in the range of categories to be included and large in the total amount to be spent. This first section then reviews the strongest case for an investment that is smaller both in terms of the number of categories to be included and the total amount to be spent. We also provide you with the best available evidence to help judge the claims being made in both cases.

In the second section, we review the proposed spending levels in each of the 11 categories of what could be included and the case for and against big investments in each.

The third section of the brief reviews the proposals for how to pay for increased infrastructure spending.

In the concluding section, we ask you to consider each the four infrastructure plans overall.

Along the way, we ask you to indicate your own conclusions. We ask about whether to include a given category and how much to spend on it after each of the 11 categories is reviewed in the second section. We ask you to indicate how you think we should pay for it in the third section. In the concluding section, we ask you whether you support or oppose each of the four infrastructure packages reviewed overall and whether support for infrastructure legislation should be tied to other legislation.

Suggestions for How to Read the Brief

Deciding whether or not we should spend hundreds of billions of dollars across 11 categories of investments is a big question. To provide complete information, this brief is necessarily long. Likely, it would take you more than the 90 minutes you committed when you joined to read each part carefully. If you are willing to spend the extra time, that will be a great help as the nation contemplates such a significant investment.

If you are not able to spend more than 90 minutes, we invite you to dig in where you think it is warranted and scan the information more quickly where that feels appropriate.

Decision science suggests that with thousands of us each making our own determinations about where to investigate more deeply, the overall results will reflect the full range of information provided to a surprising degree.

To make the topic more manageable, we have critically reviewed and then summarized hundreds of pages of studies, reports, and proposals. We have also designed this brief to be easily scannable, including many graphics that quickly summarize the most relevant information.

While you’re welcome to scan some sections, all the questions are required. You will not be able to submit your responses until you have answered each question. Please scan the information, particularly the graphs, sufficiently that you can form a reasonably informed answer.

One note of caution. We all have a tendency to seek out information that confirms our prior beliefs and ignore information that challenges them. Your individual judgment, and our collective results, will be wiser if we each seek out information that challenges our existing views, as well as information that supports them.

Getting to an Apples-to-Apples Comparison

To create apples-to-apples comparisons, we focus on proposed new spending per year.

The total amounts proposed may look different than what you have heard on the news. The reporting has been inconsistent in distinguishing between how much of each proposal is already in the current baseline of expected federal funding and how much new spending in addition to the baseline is proposed. President Biden has generally described his plan in terms of new spending and has not included the baseline in his total. Senate Republicans, in contrast, have generally included the baseline funding as part of their total proposed spending.

The press has also been inconsistent in distinguishing between the timelines for spending the money. The American Jobs Plan calls for spending the total amount proposed over the course of 10 years. The Senate Republican and the Problem Solvers Caucus plans propose eight years of spending. The Common Sense Coalition plan, now with the support of President Biden, proposes spending over a five year period.

To create an apples-to-apples comparison, we have created Figure 1. Our discussion and Figure 1 focus on the average amount of new federal spending proposed per year that is above the expected federal baseline. 

The parties have agreed to assume about $80 billion per year in baseline funding overall. Figure 1 breaks out the current baseline spending from how much each proposal would add to it. The apples-to-apples comparison then, is that President Biden’s revised American Jobs plan proposes $170 billion and the Senate Republicans’ revised plan proposes $37.7 billion. Spent over five rather than eight or ten years, the Common Sense Coalition (now supported by President Biden) proposes $115.8 billion per year.  While the Problems Solvers Caucus in the House proposes slightly more in total spending than their bipartisan Senate colleagues in the Common Sense Coalition, their proposed new spending each year comes in at a much lower  $77.3 billion because it is spread over eight years rather than five.

Benchmarks for Judging How Much We Should Spend

Objective benchmarks of the actual infrastructure need are one of the most useful ways of moving beyond supporting one proposal over another simply because of who proposes it. Figure 1 summarizes the four proposals and compares them to three benchmarks.

First, we provide a letter grade for the current condition of infrastructure. These grades are awarded by the American Society of Civil Engineers’ (ASCE) in their 2021 Report Card for America’s Infrastructure. Issued every four years, it is a frequently cited source on the state of American infrastructure. As seen in Figure 1, ASCE gives America’s overall infrastructure a grade of C- which is a slight improvement over the D+ it earned in 2017. Below that, we also provide the grades that ASCE awards for six of the 11 individual categories of infrastructure that we consider, as well as the trend line of whether the condition of each is declining, staying steady, or improving (they do not provide grades for the other five categories).

Second, we provide ASCE’s estimates of infrastructure funding needs where available as a benchmark. Figure 1 states each proposal in terms of the percentage of estimated funding needed to bring the grade up to a B.

Third, where available, we provide the current baseline levels of federal funding. Figure 1 expresses each proposal in terms of the percentage increase in federal baseline spending.

Figure 1a: Comparing New Infrastructure Proposals - Overall Yearly Spend

ASCE ESTIMATES

C-

Current Grade

Trending Slightly Up

Trend - Slightly Up

$251B

Funding needed to raise to a "B" Grade

PROPOSED ANNUAL INCREASE

ASCE VS NON-ASCE FUNDING

PROPOSED ANNUAL INCREASE

ASCE VS NON-ASCE FUNDING

% COVERED FOR AN ASCE "B" GRADE

Biden
GOP
CSC
PSC
  • Remaining need not covered by federal
  • Need covered by Biden
  • Need covered by GOP
  • Need covered by CSC
  • Need covered by PSC

TOTAL DOLLARS ALLOCATED BY CATEGORY

Click category names in the legend below to hide and show various different categories.

*Other category includes items that we do not cover in the brief like Infrastructure Financing Bank, Multimodal Large Investments, and Asset Recycling.

We are also including Figure 1b in this first section of the brief so that you can see an overview of what each plan proposes in all 15 categories before we turn to the category-specific section of the brief.

If you would like to bypass the 15 category summary Click Here

Figure 1b: Comparing Yearly New Infrastructure Spending Proposals - Broken out by Category

1. SURFACE TRANSPORTATION

ASCE ESTIMATES

n/a

Current Grade

n/a

Trend

$122B

Funding needed to raise to a "B" Grade

PROPOSED ANNUAL INCREASE

% COVERED FOR AN ASCE "B" GRADE

  • Remaining need not covered by federal
  • Need covered by Biden
  • Need covered by GOP
  • Need covered by CSC
  • Need covered by PSC

Learn More about SURFACE TRANSPORTATION


Infrastructure

When most people think of infrastructure, they think first of roads and bridges. The passenger and freight rail system and public transit are also important categories of surface transportation. We will consider surface transportation first as a whole and then examine each of three sub-categories.

The ASCE 2021 Report Card estimates that we need $122 billion per year in total new funding (including state and local) to raise the condition of our surface transportation to a B grade. President Biden’s plan would add $30.4 billion per year, which is 25% of the new funding needed and a 44% increase in federal baseline spending. The Senate Republicans’ plan would add $15.5 billion per year, which is 13% of the new funding needed and a 23% increase in federal funding. The Common Sense Coalition plan that President Biden now supports proposes $47.1 billion in new funding, which is 39% of the need and a 69% increase in federal funding. The Problem Solvers’ plan proposes $38.7 billion, providing 32% of the need and a 57% increase in federal funding per year.


1a. ROADS & BRIDGES (WITH SAFETY INVESTMENTS)

ASCE ESTIMATES ROADS

D

Current Grade

Trending Steady

Trend - Steady

?

Funding needed to raise to a "B" Grade

ASCE ESTIMATES BRIDGES

C

Current Grade

Trending Slightly Down

Trend - Slightly Down

?

Funding needed to raise to a "B" Grade

PROPOSED ANNUAL INCREASE

% COVERED FOR AN ASCE "B" GRADE

ASCE does not break out amount needed for Roads & Bridges. It is included in the total need for Surface Transportation.

Learn More about ROADS & BRIDGES


Roads and Bridges

The ASCE 2021 Report Card gives our roads a D grade, the same grade they earned in 2017. The nation’s bridges got a grade of C in 2021, down from a C+ in 2017. ASCE does not provide an estimate of what it would take to increase the grade of our roads and bridges to a B separate from the overall surface transportation category.

Investing in improved roads and bridges is one of the areas of greatest agreement between President Biden and Senate Republicans. Though President Biden was initially calling for substantially more than Senate Republicans, he adjusted to propose close to the same amount. President Biden’s revised American Jobs Plan proposed $13.9 billion in new spending per year and Senate Republicans propose $13.7 billion. President Biden’s plan represented a 27% increase in federal baseline funding and the Senate Republicans’ plan is a 26% increase. At $24.2 billion, the CSC plan that President Biden now supports would increase federal funding by 46%, the most of the four plans. At $20.6 billion, the PSC plan is the second most proposed and a 39% increase in federal spending.

The Case for a Big Investment

Supporters argue that a significant increase in road and bridges funding attracts such broad, bipartisan consensus because no other category of infrastructure more directly impacts Americans’ daily lives. Sitting in slow traffic is a major frustration experienced everyday by millions of Americans, supporters observe.

Beyond inconvenience, supporters argue, there is also broad consensus that the substandard condition of too many of our roads and bridges imposes unacceptable economic, safety, and environmental costs. Economically, roads and bridges in poor condition are costly in terms of delays caused by traffic congestion and extra repairs. In terms of safety, they argue, poor roads and bridges cause too many preventable injuries and deaths. In terms of the environment, longer travel times due to congestion also mean higher levels of greenhouse gas emissions that contribute to climate change.

The Case for a Smaller Investment

There are some ranging from the very conservative to the very liberal who argue for more modest levels of road and bridge funding. First, they argue that most of the critical roads and bridges are in an acceptable condition and that the economic, safety, and environmental costs are often exaggerated. Increasing federal spending by more than 25%, they argue, only means that we will invest in roads and bridges further down the cost/benefit ratio priority list.

Second, supporters of a more modest increase observe that expanding their capacity does little in the long run to address the traffic congestion problem. They cite the common experience in which highway expansion only initially results in less congestion and shorter commute times. Over time, those shorter commute times make living farther out from the urban centers more feasible. Consequently, more and cheaper housing is built farther out from cities creating the congestion problem all over again. We will never get ahead of the curve, they argue, by simply expanding road capacity.

Third, some point out that we came to more fully appreciate the advantages of remote work during the pandemic. By not driving our cars to work, some argue, we not only save time and money, but we also reduce the number of injuries and deaths caused by car accidents and reduce carbon emissions. Supporters of a more modest infrastructure investment argue that we do not yet know how much the experience with remote work will decrease the congestion and wear and tear on America’s roads long term. Now, they argue, is not the time for a major increase in roads funding.

The Evidence

ASCE finds that 43% of our roads are in poor or mediocre condition, a number that has stayed steady for many years. The vast majority of those roads in poor and mediocre condition are more minor roads, with most interstate freeways in good or excellent condition. ASCE reports that 7.5% of the nation’s bridges are designated structurally deficient, an improvement from 12.1% a decade ago.

ASCE also finds that 30% of the trips in the United States are impacted by severe or extreme traffic congestion, causing an extra 8.8 billion hours in travel time and burning an extra 3.3 billion gallons of fuel. Roads in sub-standard condition also cause nearly $130 billion per year in extra vehicle repairs and operating costs.

Nevertheless, ASCE acknowledges that the evidence shows how elusive it is to reduce congestion impacts by spending more on our roads. In part, this is because of “induced demand,” the technical term for the common effect observed that decreasing congestion by investing in increased road capacity is often ineffective because it leads to greater housing development farther out from cities. In its 2021 Report Card, ASCE said:

“However, as every lane-mile of road costs approximately $24,000 annually in operation and maintenance, roadway expansion can be more costly and less efficient than operational changes. In fact, in many cases, roadway expansion can lead to induced demand and further sprawl.”

The ASCE figure of $24,000 in annual operation and maintenance costs for every lane-mile does not include the much higher upfront capital costs of building new lanes in the first place.


1b. PASSENGER & FREIGHT RAIL

ASCE ESTIMATES

B

Current Grade

Trending Steady

Trend - Steady

?

Funding needed to raise to a "B" Grade

PROPOSED ANNUAL INCREASE

% COVERED FOR AN ASCE "B" GRADE

ASCE does not break out amount needed for Passenger & Freight Rail. It is included in the total need for Surface Transportation.

Learn More about PASSENGER & FREIGHT RAIL


Passenger & Freight Rail

The rail system that carries both passengers and freight in our country earns a grade of B. That is the second highest grade ASCE gave in 2021 and the same grade the rail system got in 2017. Since ASCE’s estimates for new funding need are based on what it would take to achieve a B, no additional spending is needed to achieve that for rail.

Nevertheless, all four new spending plans include percentage increases that are the largest of all categories. The White House plan proposed $8 billion in additional spending each year, a 267% increase in federal funding. Senate Republicans call for $2.8 billion in new spending on our rail system. At 92%, it is the single biggest increase in federal infrastructure spending proposed by Senate Republicans. The Common Sense Coalition proposal that President Biden now supports includes $13.2 billion, a 440% increase in federal funding. The Problem Solvers’ plan for $12 billion in new spending is a 400% increase.

The Case for a Big Investment

The far greater energy efficiency of rail compared to roads in transporting people and goods is a major reason offered by supporters for a particularly large increase in federal spending on rail. Supporters also point out that passenger rail, particularly in the Northeast Corridor, is subject to many costly and frustrating delays due to the inferior condition of the rail infrastructure. Reducing those delays, they argue, would increase ridership and help reduce the traffic delays on the northeast’s crowded highways.

The Case for a Smaller Investment

Both Republicans and Democrats who argue for a more modest investment in rail emphasize ASCE’s finding that the country’s rail system has already achieved the target B grade and is in better condition than almost all other categories of infrastructure. Because its condition has been good and steady at current levels of federal funding, opponents argue that even the Republican proposal to nearly double the level of federal funding for rail is simply not justified. They argue that much larger increases in the other three plans are even less justified.

The Evidence

The Federal Railroad Administration found that rail is 1.9 to 5.5 times more fuel efficient than trucks for transporting goods, depending on route and distances. ASCE also reported 328,000 train-delay minutes (about 5,467 hours) per year within the Northeast Rail Corridor due to infrastructure-related issues.


1c. PUBLIC TRANSIT

ASCE ESTIMATES

D-

Current Grade

Trending Steady

Trend - Steady

?

Funding needed to raise to a "B" Grade

PROPOSED ANNUAL INCREASE

% COVERED FOR AN ASCE "B" GRADE

ASCE does not break out amount needed for Public Transit. It is included in the total need for Surface Transportation.

Learn More about PUBLIC TRANSIT


Public Transit

ASCE gave our public transit system a D- in 2021, the same grade that it got in 2017.

Here, the difference between the White House and Senate Republicans is especially large. The Biden Administration’s plan included $8.5 billion annually in new funding for public transit, a 64% increase in federal funding. The Senate Republicans’ plan would actually reduce current funding by $1 billion, an 8% decrease in current federal funding. The CSC proposal that President Biden now backs would spend $9.7 billion, a 73% increase in federal funding. The Problem Solvers’ proposal to spend $6.2 is a 47% increase.

The Case for a Big Investment

Public transit supporters argue that it provides an effective solution to the congestion problem. Unlike traveling by personal cars, public transit becomes more cost efficient with higher levels of ridership. Because it avoids the induced demand problem, they argue, it is a real congestion solution. In addition, proponents argue that public transit emits fewer greenhouse gases and provides transportation essential to those who cannot afford their own car.

The Case for a Smaller Investment

Even before the pandemic, many Republicans argue, people were voting with their feet and ridership on public transit was declining. With the experience of the many advantages of remote work and greater concern about communicable diseases since the pandemic, opponents suggest now is not the time for significant increases in public transit investment.

The Evidence

ASCE reports that 19% of transit vehicles and 6% of tracks and tunnels are in “poor” condition. About 45% of Americans do not have access to public transit. The total number of public transit trips peaked in 2014 and had declined by 8% prior to the pandemic. Nearly 50% of public transit trips are by bus.


2. BROADBAND

ASCE ESTIMATES

n/a

Current Grade

n/a

Trend

n/a

Funding needed to raise to a "B" Grade

PROPOSED ANNUAL INCREASE

% COVERED FOR AN ASCE "B" GRADE

n/a

Learn More about BROADBAND


Broadband Infrastructure

The newest form of physical infrastructure we consider also attracts strong bipartisan support for new investments. Democrats and Republicans agree that the accessibility of high-speed internet connections for homes and businesses is increasingly important. Because both rural areas and lower income urban areas are underserved, broadband tends to bridge the usual partisan divides.

The country’s broadband infrastructure made it into the ASCE Report Card for the first time in 2021. Because the category is so new they did not have the same metrics and comparisons as they do for other kinds of infrastructure. Consequently, they did not give it a grade or estimate how much more funding is needed. The report concluded that “American’s reliance on fast internet is only forecasted to grow in coming years.”

President Biden and Senate Republicans not only agree that broadband deserves significant new funding, they also now agree on just how much more. The American Jobs Plan originally called for $10 billion in new broadband spending per year but reduced it to $8.1 billion to match Senate Republicans’ plan. Because the Common Sense Coalition plan that President Biden now supports calls for spending the same total amount over the shorter five year time period, that plan works out to $13 billion each year in new broadband funding. The Problem Solvers Caucus calls for $5.6 billion per year in new spending.

The Case for a Big Investment

While the pandemic has created questions about whether demand for various types of transportation infrastructure will be reduced long-term by our experience with remote work, it highlighted for Democrats and Republicans alike how critical the infrastructure is that provides high-speed internet connections. Even before the pandemic, the importance of broadband was increasing rapidly, they observe. Economically, broadband provides access to the increasingly wide range of opportunities for remote work and can make the difference in businesses’ decisions about where to locate. Broadband was also already providing access to an exploding range of remote learning resources, supporters note. Increasingly, broadband has been facilitating access to healthcare delivery, including through telemedicine. The pandemic significantly accelerated all these developments, advocates observe.

Supporters argue that investing significantly more in high-speed internet connectivity today is akin to investing in rural electrification in the 1930’s or the interstate highway system in the 1950’s. Proponents argue that this investment will fundamentally make our economy and society more efficient and effective.

Supporters also argue that significant new investments in broadband will help our nation live up to its ideal of equal opportunity for all by powerfully addressing economic, educational, and health inequities. Underserved communities are found in both rural and distressed urban areas. Access to greater economic and educational opportunities, and to healthcare, are most profoundly needed in these areas of our country, supporters argue.

The Case for a Smaller Investment

Some argue that the free market has already provided high-speed internet connections everywhere that it is cost-effective to do so. Where that investment would make a strong economic return, public utilities and other for-profit companies have already built out the necessary infrastructure. Extending broadband where it currently is not available, opponents argue, will be prohibitively expensive and bring benefits to fewer people.

The Evidence

The National Association of Counties (NACo) found that in 2020 65% of counties had average connection speeds slower than the definition of broadband. NACo found that slow connections were particularly common in less populated counties. According to the Center for Public Integrity, households with incomes over $80,700 are five times more likely to have access to broadband than households with less than $34,800 in income.


3. WATER INFRASTRUCTURE

ASCE ESTIMATES

C-

Current Grade

Trending Up

Trend - Up

?

Funding needed to raise to a "B" Grade

PROPOSED ANNUAL INCREASE

% COVERED FOR AN ASCE "B" GRADE

ASCE does not break out amount needed for water.  It is included with the total amount along with wastewater and stormwater.

Learn More about WATER INFRASTRUCTURE


Water Infrastructure

The systems that convey water to our homes and businesses make up a fundamental category of infrastructure. In 2021, ASCE gave the nation’s water infrastructure a C-, up from the D it got in 2017. ASCE did not provide an estimate of how much new funding would be needed to improve the condition of our water infrastructure to a B separate from its estimate of $43.4 billion needed for drinking water along with wastewater and stormwater infrastructure.

The infrastructure that brings water to American homes and businesses gets among the highest proposed increases in federal funding in all four infrastructure plans. The American Jobs Plan has the largest proposal with $11.1 billion per year in new water infrastructure spending, a 370% increase. The Republican plan calls for $6 billion, a 200% increase in federal baseline spending. The CSC framework that President Biden now supports proposes $11 billion, a 368% increase. The PSC plan proposes $4.5 billion, a 150% increase.

The Case for a Big Investment

Democratic and Republican proponents of a major increase in spending on our water infrastructure particularly emphasize the need to eliminate lead pipes. Given the known significant health risks, there is wide agreement that the number of homes and businesses that get their water through lead pipes remains alarmingly and unacceptably high. Proponents also argue that the number of water main breaks is too high and getting higher.

The Case for a Smaller Investment

Those who argue for a more modest investment in our water infrastructure point out that it is already improving without more investment, increasing from a D in 2017 to a C- in 2021.

The Evidence

The EPA reports an estimated six to ten million homes still receive drinking water through lead pipes and service lines. The ASCE cites a report that there were an estimated 250,000 – 300,000 water main breaks in 2018, a 27% increase from 2012.


4. AIRPORTS

ASCE ESTIMATES

D+

Current Grade

Trending Slightly Up

Trend - Slightly Up

$11.1B

Funding needed to raise to a "B" Grade

PROPOSED ANNUAL INCREASE

% COVERED FOR AN ASCE "B" GRADE

  • Remaining need not covered by federal
  • Need covered by Biden
  • Need covered by GOP
  • Need covered by CSC
  • Need covered by PSC

Learn More about AIRPORTS


Airports

ASCE gave the nation’s airports a grade of D+ in 2021, up from a D in 2017. ASCE estimates that $11.1 billion more per year is needed to bring airports up to a B.

President Biden’s American Jobs Plan includes $2.5 billion in new federal airports funding per year, covering 23% of the ASCE-estimated new funding need and representing a 66% increase in federal funding. At $3.2 billion, the Senate Republican plan actually calls for more. The Senate Republican plan is 29% of the additional funding need estimated by ASCE and an 84% increase in current federal funding. The Common Sense Coalition plan that President Biden now supports proposes $5 billion, an investment that would cover 45% of the need and would increase federal funding by 132%. At $1.3 billion, the Problem Solvers propose the smallest airport investment, an investment that would cover 12% of the estimated need and increase federal funding 35%.

The Case for a Big Investment

Air travel, proponents argue, is critical to robust commerce both domestically and internationally. Air travel delays are excessive, they argue, and enormously disruptive for both business and personal travel. We need to invest in greater airport capacity if we are to reduce travel delays.

The Case for a Smaller Investment

Like other forms of transportation, proponents of a smaller increase in airport infrastructure argue that the demand for air travel may see a long-term reduction because of the pandemic. Even more than travel by personal car, rail, or public transit, some argue, the pandemic demonstrated how costly business air travel is. A video conference meeting, they point out, saves significant time and expense and leaves a far smaller carbon footprint. Before investing significantly in increased air travel capacity, they argue, we should first see what demand after the pandemic will be.

The Evidence

ASCE’s 2021 report card cited the National Plan of Integrated Airport Systems (NPIAS) findings that two core measures of airport infrastructure conditions were nearly unchanged. The “on-time” flights decreased slightly from 80.1% in 2017 to 79.2% in 2019. ASCE suggested that the slight on-time flight decrease was due to growth in passenger travel without a corresponding number of available flights. ASCE acknowledges that the post-pandemic demand picture is unclear. NPIAS also reports that over the same time the percentage of runways in excellent, good, or fair condition increased slightly from 97.8% to 97.9%. Given the significant reduction in flights during the pandemic, the wear and tear on runways has been less since 2019.


5. PORT & WATER WAYS

ASCE ESTIMATES PORTS

B+

Current Grade

Trending Up

Trend - Up

$0

Funding needed to raise to a "B" Grade

ASCE ESTIMATES WATER WAYS

D+

Current Grade

Trending Slightly Up

Trend - Slightly Up

$2.5B

Funding needed to raise to a "B" Grade

PROPOSED ANNUAL INCREASE

% COVERED FOR AN ASCE "B" GRADE

  • Remaining need not covered by federal
  • Need covered by Biden
  • Need covered by GOP
  • Need covered by CSC
  • Need covered by PSC

Learn More about PORT & WATER WAYS


Ports and Waterways

American ports and inland waterways are another important way that we move goods in our country. ASCE gives our ports a B+, the highest grade that they gave any category of infrastructure. It is also one of the most rapidly improving categories, improving a full grade from the C+ they earned in 2017. The B+ is also beyond the ASCE target of a B for increased funding. On the other hand, our inland waterways infrastructure, much of which facilitates moving goods on the Mississippi and other major river systems, received a D+, up from a D in 2017. ASCE estimates that $2.5 billion per year is required to bring inland waterways up to a B.

The Biden Administration proposed $1.7 billion in new spending per year for both ports and inland waterways, which is 68% of the ASCE estimated need and a 94% increase in federal baseline funding. Senate Republicans call for $1 billion, which is 40% of the ASCE estimated need and a 56% increase in federal funding. CSC, now with President Biden’s support, calls for $3.3 billion, which is 130% of the need and a 181% increase in federal funding. PSC’s plan includes $1.5 billion, which is 58% of the estimated need and an 81% increase in federal funding.

The Case for a Big Investment

Democratic and Republican proponents observe that moving goods by water is more cost and energy efficient even than moving them by rail and much more cost effective than by truck.

The Case for a Smaller Investment

Proponents for a smaller investment point to the ASCE grade of B+ for ports. With the highest grade of all categories of infrastructure evaluated and an improving grade, they argue, ports are simply an unwise place to significantly increase federal funding. While the ASCE grade of D+ for inland waterways indicates a greater need for investment, proponents of a more modest investment emphasize that their condition is improving at current levels of federal investment. Given these grades, they argue, even the Senate Republican’s call for a 56% increase in combined federal spending for ports and inland waterways is excessive. The other three plans are even more excessive, they argue.

The Evidence

A 2017 update of the report by the Texas Transportation Institute at Texas A&M University found that it is 70 times more fuel efficient to move dry cargo by barge than by truck and 16 times more fuel efficient than by rail. ASCE reported that the tonnage at America’s top ports grew by 4.4% from 2015 to 2019.


6. WATER STORAGE

ASCE ESTIMATES

D

Current Grade

Trending Steady

Trend - Steady

$8.1B

Funding needed to raise to a "B" Grade

PROPOSED ANNUAL INCREASE

% COVERED FOR AN ASCE "B" GRADE

  • Remaining need not covered by federal
  • Need covered by Biden
  • Need covered by GOP
  • Need covered by CSC
  • Need covered by PSC

Learn More about PORT & WATER WAYS


Water Storage

Dams are built in all 50 states to store water. Dams are also built to control floods, generate hydroelectric power, irrigate, and provide recreation. The ASCE Report Card gives America’s dams a D, the same grade they received in 2017. ASCE estimates that $8.1 billion in new funding is needed each year for dams to get to a B.

President Biden and Republican Senators have now agreed that there is a need for new funding for water storage. President Biden called for $300 million in new federal funding per year, which is 4% of the ASCE estimated need and a 17% increase in federal funding. The Senate Republican plan and the Common Sense Coalition plan that President Biden now supports both include $1 billion in new funding, which is 12% of ASCE’s estimated need and a 56% increase in federal spending. The Problem Solvers Caucus proposes decreasing federal baseline spending by $100 million per year, a 3% reduction.

The Case for a Big Investment

Within the focus on water storage, the President, Senate Republicans, and the Common Sense Coalition have agreed that the need is particularly concentrated in the American West. The arid conditions typical of the west make water storage critical infrastructure for reliable access to water. They argue that a severe long-term drought, coupled with rapidly growing populations and an aging dam infrastructure, has made the issue of adequate, reliable water storage in the west even more crucial.

The Case for a Smaller Investment

As important as the need for reliable western water storage is, the Problem Solvers suggest that slightly less than current funding is sufficient to address the critical needs.

The Evidence

A 2020 update by the U.S. Army Corps of Engineers of its National Inventory of Dams cited in the ASCE report found that the number of dams with high potential for loss of life and property damage if they failed has doubled over the last 20 years. That is not because more dams have fallen into disrepair. Instead, it is because more homes and businesses are being built in areas that would be impacted by the failure of an existing dam.


7. ELECTRIC VEHICLES

ASCE ESTIMATES

n/a

Current Grade

n/a

Trend

n/a

Funding needed to raise to a "B" Grade

PROPOSED ANNUAL INCREASE

% COVERED FOR AN ASCE "B" GRADE

n/a

Learn More about ELECTRIC VEHICLES


Electric Vehicles
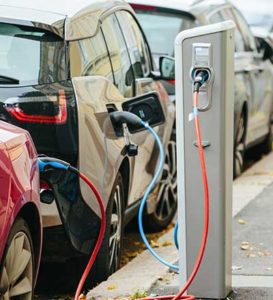
ASCE’s report card does not include a separate infrastructure category or grade for electric vehicles, though it does mention electric vehicle charging stations in its assessment of the electric grid. A baseline of current federal spending on electric vehicles has also not been provided.

Senate Republicans did not include investments for electric-vehicle-related infrastructure in their original proposal but have now agreed they should be included. The Common Sense Coalition and the Problem Solvers Caucus also include it. Wide differences remain among the four plans, however, over what to include in the investment and how much to invest.

The American Jobs Plan proposed $17.4 billion in new spending per year for investments in electric vehicles, most of which is divided over three sub-categories. The first sub-category arguably fits the usual understanding that infrastructure includes physical systems built to be broadly available to the public and that help the economy function efficiently. It would provide $1.5 billion per year in grants and incentives for state and local governments to build a national infrastructure of 500,000 electric-vehicle chargers. The other two electric-vehicle sub-categories reflect a broader definition of infrastructure. President Biden proposed $10 billion in new spending per year for rebates and tax incentives to encourage the purchase of American-made electric vehicles. He also proposed $4.5 billion per year to replace diesel transit vehicles with electric ones and to electrify school buses.

The latest proposal by Senate Republicans calls for $0.5 billion per year for electric vehicle charging stations.

President Biden now supports CSC’s plan for $3 billion, half of which would be for charging stations and the other half would be for low and no carbon emission buses and ferries. PSC would invest $3.1 billion for both charging stations and electric buses.

The Case for a Big Investment

Electric vehicle supporters argue that the technologies both for alternative sources of electricity like solar and wind power as well as for plug-in electric vehicles themselves are improving rapidly. Those technological improvements, they argue, make it smart economically for the nation to move boldly toward electric vehicles. Leading the global market for electric vehicles can be a source of good middle-class jobs for decades to come, the White House suggests, just as U.S. leadership in gas and diesel cars and trucks have provided Americans with good jobs going back to the Ford Model T. 

Moving from gas and diesel to electric vehicles that are charged by alternative electricity sources, supporters argue, will also significantly reduce greenhouse gas emissions and be a major step in addressing the challenge of climate change.

The Case for a Smaller Investment

Senate Republicans agree that investment in a national infrastructure for electric vehicle charging stations is appropriate for inclusion in an infrastructure package because it fits within the standard definition of the term. Many also agree that moving towards electric vehicles is smart economically and environmentally.

Senate Republicans argue, though, that it is wiser to move more slowly than the Biden Administration proposes, particularly given the massive increases in other federal spending.

Senate Republicans also suggest that the other two electric vehicle parts of the American Jobs Plan investments are both excessive in their amount of federal spending and beyond the definition of infrastructure. Opponents argue that whatever the merits of rebates and tax incentives for purchasing American-made electric vehicles and for electrifying transit vehicles and school buses, they are not for a debate about infrastructure.

The Evidence

The National Renewable Energy Laboratory study estimates the United States will need about 628,000 public chargers to accommodate 15 million electric vehicles by 2030. A 2021 analysis by McKinsey & Company found that globally 48% of plug-in electric vehicles are purchased in China, 35% in the European Union, and 15% in the U.S. The 2020 report by the American Security Project concludes that China’s electric-vehicle strategy has invested far more than the U.S. in electric vehicle infrastructure by installing thousands of charging stations per month. In contrast, the U.S. strategy has focused on technological innovation to build better electric vehicles.


8. POWER

ASCE ESTIMATES

C-

Current Grade

Trending Slightly Up

Trend - Slightly Up

$19.7B

Funding needed to raise to a "B" Grade

PROPOSED ANNUAL INCREASE

% COVERED FOR AN ASCE "B" GRADE

  • Remaining need not covered by federal
  • Need covered by Biden
  • Need covered by GOP
  • Need covered by CSC
  • Need covered by PSC

Learn More about POWER


Power Grid Infrastructure

Our power grid delivers the electricity that is essential to homes, businesses, schools, hospitals, and other essential services. ASCE gives our energy infrastructure a C-, up from a D in 2017. ASCE estimates that $19.7 billion per year in new spending would be needed to get our electrical grid to a B. Baseline levels of federal spending on our power infrastructure have not been provided.

President Biden, the Common Sense Coalition, and the Problem Solvers Caucus all agree that we should invest significantly more in our electric grid. Senate Republicans propose no new funding.

The White House proposed $4.2 billion in new federal spending each year, which is 21% of the ASCE estimated need. At $14.6 billion, CSC proposes by far the biggest investment in our electric grid. CSC’s plan would cover 74% of the estimated need. President Biden now supports CSC’s bigger investment. PSC proposes $3.1 billion in new spending per year, which is 16% of the ASCE estimated need.

The Case for a Big Investment

Severe winter storms in February 2021 caused outages that left more than 4.5 million Texas homes and businesses without power in the biting cold. Supporters suggest that the Texas experience highlights one of three main reasons our electric grid needs a major upgrade. It is not nearly resilient enough, they argue, to withstand extreme weather when that power is needed most.

A second reason given for investing substantially more in our grid is that it is also too susceptible to terrorist attack. As our connected world becomes increasingly dependent on reliable power, some argue, an aging electrical grid in mediocre condition is a soft target for those who would do us harm.

Third, supporters argue that a smart and efficient electric grid is critical to moving the country toward green energy and lower power bills. Often power sources like wind and solar are far from population centers. A modern grid, supporters argue, will more efficiently move cleaner electricity to where it is needed. Because it lowers the cost of electricity, they argue, it will also reduce Americans’ power bills. Building out the new power grid will put many Americans to work in good jobs, proponents argue. Supporters argue that beyond that, clean and affordable energy will power American productivity across our economy.

The Case for No New Investment

Opponents, including Senate Republicans, point to the meaningful improvement from a D in 2017 to a C- in 2021 as evidence that new federal spending on the electrical grid is not needed for it to improve. They also argue that the costs of power outages do not justify the level of investment proposed by the other three plans.

The Evidence

ASCE cites a slight decrease in power outages over the last four years as part of the evidence leading to the better grade for the electrical grid in 2021. ASCE also issued a 2020 Failure to Act report specifically on our electric infrastructure. As American life and its economy is increasingly wired and dependent on electricity, it found that the costs of outages are increasing. ASCE estimated that each power outage costs a household an average of $6.68 from losses such as damaged electronics and spoiled food. The report also found that the cost of power outages is disproportionately borne by businesses. ASCE estimated the impacts to the economy overall from business costs results in a loss of $13 of disposable income per household each year. ASCE cited a 2019 Government Accountability Office (GAO) study finding that from 2014 – 2018 there were four cyber-attacks on some part of the U.S. electric grid, none of which were successful in causing a power outage.


9. RECONNECTING COMMUNITIES

ASCE ESTIMATES

n/a

Current Grade

n/a

Trend

n/a

Funding needed to raise to a "B" Grade

PROPOSED ANNUAL INCREASE

% COVERED FOR AN ASCE "B" GRADE

n/a

Learn More about RECONNECTING COMMUNITIES


Reconnecting Communities

Today’s interstate freeways and other infrastructure projects within urban areas were usually built through existing communities to make them cost effective even though they cut the community on either side off from each other.

President Biden proposed $2.5 billion per year in new investments to reconnect communities divided by past infrastructure projects. The Common Sense Coalition, now with President Biden’s support, proposes $200 million per year. The Problem Solver Caucus calls for $1.3 billion per year.

The Case for a Big Investment

President Biden argues that when discussing new infrastructure investments, we cannot ignore that past infrastructure projects have been unfair. The communities divided by highway projects in the name of cost-efficiency and convenience for everyone else, the President observes, have disproportionately been communities of color and lower-income communities. The White House argues that we should address those past injustices by investing in reconnecting divided communities. We should also promote rather than diminish racial and economic justice, the Biden Administration argues, with new infrastructure projects. In the process, supporters argue, we can create more jobs.

The Case Against

Not infrastructure.

The Evidence

A recent Urban Institute report summarizes how the decisions about where to locate interstate highways and other roads have disproportionately imposed the negative impacts on working class communities and communities of color.


10. RESILIENCE

ASCE ESTIMATES

n/a

Current Grade

n/a

Trend

n/a

Funding needed to raise to a "B" Grade

PROPOSED ANNUAL INCREASE

% COVERED FOR AN ASCE "B" GRADE

n/a

Learn More about RESILIENCE


Resilience
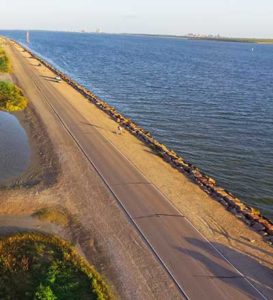
President Biden’s plan proposed $5 billion in new funding per year for building the country’s resilience to extreme weather and climate-related disasters. The American Jobs Plan identified three sub-categories of resilience work but did not specify how much of the $5 billion each would get. First, a portion of the new funds would go to building the resilience of what everyone would agree is physical infrastructure. For example, the plan would invest in making our electric grid, roads, and rails more robust to extreme weather and rising sea levels.

Each of the remaining two resilience sub-categories in the American Jobs Plan expanded the usual definition of infrastructure. The second sub-category would invest in making food systems as well as community health and hospitals more robust and in rebuilding homes and business structures above existing codes and standards after they have been destroyed or damaged, for example, by a hurricane, fire, or flood. The third resilience sub-category in the American Jobs Plan would invest in restoring lands, forests, wetlands, watersheds, and coastal and ocean resources. These investments in the natural environment would include protection against extreme fires, sea-level rise, and hurricanes.

At $9.4 billion per year, the Common Sense Coalition, now with President Biden’s support, proposes significantly more resilience funding than the American Jobs Plan. It does not break out subcategories for that investment. PSC proposes $5.6 billion for “resiliency and nature-based infrastructure.”

Senate Republicans call for investing in the resilience of our infrastructure to extreme weather and rising ocean levels with the new spending they propose in the categories discussed above. They do not consider the rest of the resilience investments proposed in the other plans to be infrastructure.

The Case for a Big Investment

Supporters argue that the failure to invest adequately in the resilience of our transportation infrastructure has disrupted service and made travel unsafe. Insufficient resilience funding has also resulted, they argue, in severe damage to our transportation infrastructure which has led to increased maintenance and operating costs. President Biden argues that we must “make our infrastructure more resilient in the face of increasingly severe floods, wildfires, hurricanes, and other risks.” The Common Sense Coalition and the Problem Solvers Caucus agree.

Supporters also argue that people of color and working class individuals are more likely to live in areas prone to extreme weather impacts like flooding. By focusing the new resilience investments in these vulnerable communities, they argue, we can address this fundamental unfairness while also creating jobs.

The Case Against

Not infrastructure.

The Evidence

A 2017 General Accounting Office report found that extreme weather and fire events have cost the federal government an average of $35 billion per year over the previous ten years, $2.8 billion (8%) of which per year was for “maintenance and repairs to federal facilities and federally managed lands, infrastructure, and waterways.”


11. ENVIRONMENTAL REMEDIATION

ASCE ESTIMATES

n/a

Current Grade

n/a

Trend

n/a

Funding needed to raise to a "B" Grade

PROPOSED ANNUAL INCREASE

% COVERED FOR AN ASCE "B" GRADE

n/a

Learn More about ENVIRONMENTAL REMEDIATION


Environmental RemediationThe American Jobs plan would invest $5.6 billion, the CSC, now with President Biden’s support, would invest $4.2 billion, and the PSC would invest $5.8 billion per year in new funding for environmental remediation of several kinds. For example, all three would invest in capping old oil and gas wells and restoring and reclaiming abandoned mines. They would provide funding to remediate and redevelop former industrial and energy sites that are now idle.

All three plans also include investments in next generation industries within this broad category. For example, projects would include retrofitting old facilities to reduce carbon emissions by converting some of those emissions into decarbonized hydrogen that can be used for power generation, industrial heating, or as an industrial feedstock. Other projects would include retrofitting large steel, cement, and chemical production facilities to demonstrate effective carbon capture methods.

The Case for a Big Investment

The environmental remediation projects described in the American Jobs Plan are included in the same section that proposes investments in the electric grid and moving further toward alternative energy sources. The White House notes that moving the nation’s energy infrastructure away from fossil fuels to cleaner, greener energy will disrupt communities reliant on fossil fuel industries. Supporters argue that it makes sense to pair the investments in cleaner energy with investments that will create good new jobs in those communities while also remediating the environmental impacts of our older energy sources and industries.

The Case Against

Not infrastructure.

The Evidence

A 2020 joint study by Resources for the Future and Columbia University reported that there is a known inventory of 56,600 orphaned oil and gas wells (meaning no owner can be found). The study estimated that it would take $1.4 – $2.7 billion to plug and stop the pollution which often includes leaking greenhouse gases. The study also estimated that there are as many as 500,000 not yet specifically inventoried wells and plugging all of them would cost $12 – $24 billion. A 2020 General Accounting Office report identified that about 67,000 abandoned hardrock mine features pose or may pose physical safety hazards and about 22,500 that pose or may pose environmental hazards.