To create apples-to-apples comparisons, we focus on proposed new spending per year.
The total amounts proposed may look different than what you have heard on the news. The reporting has been inconsistent in distinguishing between how much of each proposal is already in the current baseline of expected federal funding and how much new spending in addition to the baseline is proposed. President Biden generally described his plan in terms of new spending and did not include the baseline in his total. Senate Republicans, in contrast, generally included the baseline funding as part of their total proposed spending.
The press has also been inconsistent in distinguishing between the timelines for spending the money. The American Jobs Plan called for spending the total amount proposed over the course of 10 years. The Senate Republican and the Problem Solvers Caucus plans proposed eight years of spending. The bipartisan Senate bill that the Common Sense Coalition and President Biden negotiated, proposes spending over a five-year period.
To create an apples-to-apples comparison, we have created Figure 1. Our discussion and Figure 1 focus on the average amount of new federal spending proposed per year that is above the expected federal baseline.
The parties have agreed to assume about $80 billion per year in baseline funding overall. Figure 1 breaks out the current baseline spending from how much each proposal would add to it. The apples-to-apples comparison then, is that President Biden’s revised American Jobs plan proposed $170 billion and the Senate Republicans’ revised plan proposed $37.7 billion. Spent over five rather than eight or ten years, the Common Sense Coalition proposed $115.8 billion per year, though their bill that passed the Senate paired that down to $110 billion per year. While the Problems Solvers Caucus in the House proposes slightly more in total spending than their bipartisan Senate colleagues in the Common Sense Coalition, their proposed new spending each year comes in at a much lower $77.3 billion because it is spread over eight years rather than five.
Objective benchmarks of the actual infrastructure need are one of the most useful ways of moving beyond supporting one proposal over another simply because of who proposes it. Figure 1 summarizes the four proposals and compares them to three benchmarks.
First, we provide a letter grade for the current condition of infrastructure. These grades are awarded by the American Society of Civil Engineers’ (ASCE) in their 2021 Report Card for America’s Infrastructure. Issued every four years, it is a frequently cited source on the state of American infrastructure. As seen in Figure 1, ASCE gives America’s overall infrastructure a grade of C- which is a slight improvement over the D+ it earned in 2017. Below that, we also provide the grades that ASCE awards for six of the 11 individual categories of infrastructure that we consider, as well as the trend line of whether the condition of each is declining, staying steady, or improving (they do not provide grades for the other five categories).
Second, we provide ASCE’s estimates of infrastructure funding needs where available as a benchmark. Figure 1 states each proposal in terms of the percentage of estimated funding needed to bring the grade up to a B.
Third, where available, we provide the current baseline levels of federal funding. Figure 1 expresses each proposal in terms of the percentage increase in federal baseline spending.




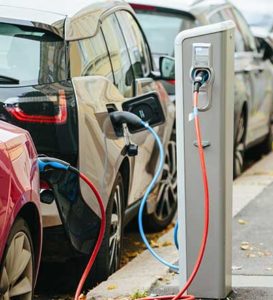 ASCE’s report card does not include a separate infrastructure category or grade for electric vehicles, though it does mention electric vehicle charging stations in its assessment of the electric grid. A baseline of current federal spending on electric vehicles has also not been provided.
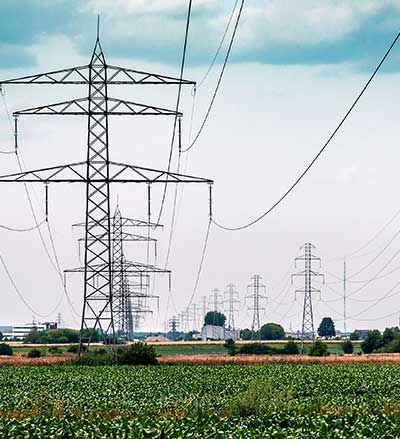
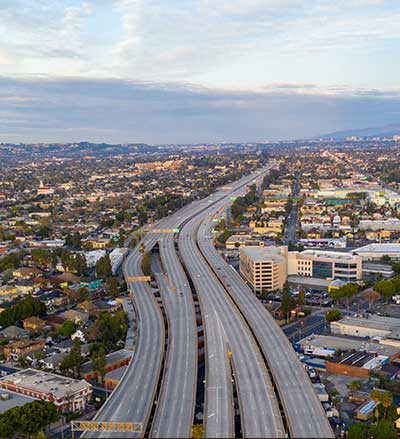
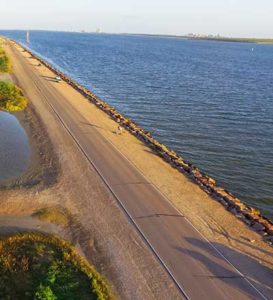 President Biden’s plan proposed $5 billion in new funding per year for building the country’s resilience to extreme weather and climate-related disasters. The American Jobs Plan identified three sub-categories of resilience work but did not specify how much of the $5 billion each would get. First, a portion of the new funds would go to building the resilience of what everyone would agree is physical infrastructure. For example, the plan would invest in making our electric grid, roads, and rails more robust to extreme weather and rising sea levels.
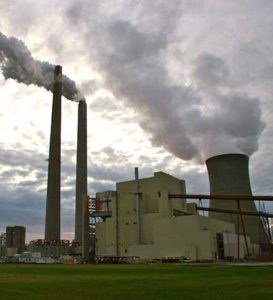 The American Jobs plan would invest $5.6 billion, the CSC, now with President Biden’s support, would invest $4.2 billion, and the PSC would invest $5.8 billion per year in new funding for environmental remediation of several kinds. For example, all three would invest in capping old oil and gas wells and restoring and reclaiming abandoned mines. They would provide funding to remediate and redevelop former industrial and energy sites that are now idle.